

Debugging#
Visual Script exposes execution highlights, breakpoints, logs, and scene gizmos for inspecting Event behavior. Use them to locate whether a failure starts in the Trigger, a Condition, a value, or a target.
Watching an Event run#
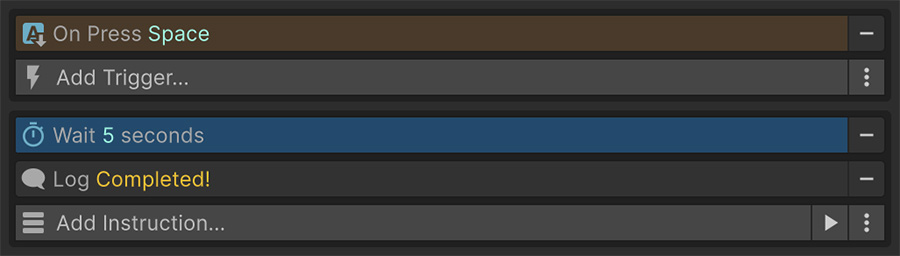
Start with the Inspector. During Play mode, an Event highlights its current Instruction as execution moves through the list. Use these highlights to choose what to inspect next:
| What you see | Check |
|---|---|
| Nothing highlights | Whether the Trigger fired. |
| It highlights and stops partway | Whether the Instruction is waiting or the Event was canceled. |
| It runs straight past an If | Whether its Conditions failed. |
| It runs but the game doesn't change | Whether the Instruction targets the intended object and value. |
Check the Trigger before anything else
Put Debug Log Text first in the Instructions list. If it doesn't print, inspect the Trigger before the logic below it.
Breakpoints#
Every Instruction and Condition has a breakpoint marker. When set, reaching it pauses the editor, letting you inspect the whole scene at that exact moment.

Breakpoints are editor-only and are ignored in builds. They can remain in the Event when you ship.
A breakpoint on a Condition pauses at the moment the check is evaluated. The compared values remain available for inspection.
Disabling#
Sometimes you want to skip an Instruction without removing it. Right-click on an Instruction or Condition to toggle it disabled.

The disabled entry stays in the list, appears grayed out, and is skipped at runtime. Unlike deleting and re-adding it, this preserves the configuration.
Logging#
Three Instructions write to the Console:
| Instruction | Writes |
|---|---|
| Debug Log Text | A normal message. |
| Debug Log Warning | A warning. |
| Debug Log Error | An error. |
The text is a String Signal, so you can include live values. Log the current health value when you need to check the result of a damage calculation.
Log the value, not the event
Player took damage confirms that an Event ran. Damage 12, health 45 → 33 also exposes the inputs and result needed to verify the calculation.
Warnings and errors stand out in a noisy Console and can be filtered separately. Reserve them for unexpected states rather than routine tracing.
Gizmos#
Gizmo Instructions draw spatial values in the Scene view at runtime:
| Gizmo | Draws |
|---|---|
| Line | A line between two points. |
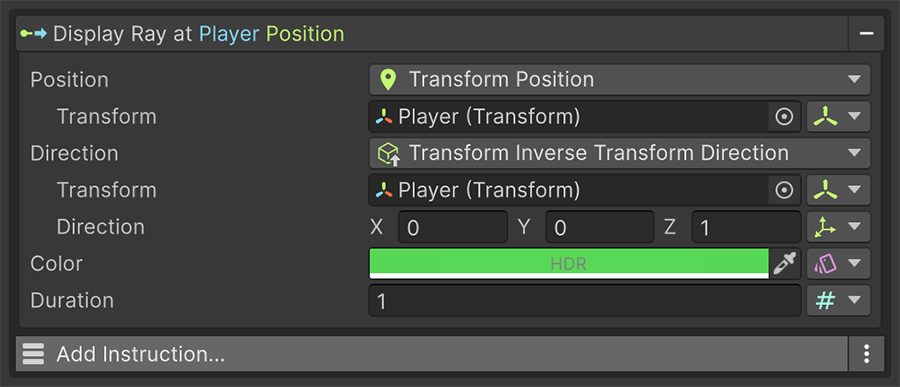
| Ray | A ray from a point in a direction. |
| Arrow | A directed arrow. |
| Sphere | A sphere. |
| Cube | A box. |
| Capsule | A capsule. |
| Circle | A flat circle. |
| Square | A flat square. |
| Stadium | A rounded rectangle. |
| Mesh | An arbitrary mesh. |
Each takes a color and a duration, so you can control how the shape looks and how long it remains visible.
Gizmos reveal a physics query
A collection using an overlap sphere has no visible boundary. Draw a Sphere gizmo at the same position and radius to compare the query volume with the enemies it includes.
Use the same approach for raycasts with Ray, distances with Line, and facing directions with Arrow.
Disabling debug in builds#
Debug output can be stripped from builds through a scripting define symbol, toggled in Editor settings.
Keep debug output during development when you need it, and turn it off for release when you don't. Logging adds runtime work and exposes logged values in the player log.
A debugging order#
Check an Event in this order:
- Is the Event running? Log as the first Instruction.
- Does it get past the Conditions? Log inside and outside the If.
- Are the values what you expect? Log them, or set a breakpoint.
- Is it targeting the right object? Log the object's name.
- Is the spatial query doing what you think? Draw a gizmo.
Where to go next#
- Instructions — use breakpoints and disabled entries within an Event.
- Editor settings — configure the debug scripting define symbol.
- Collections — inspect the physics queries that gizmos help visualize.